Greater Princeton Area Market Report
October 2026: The Unsold Pile Aged Again
Key Market Statistics, October 2026
The figures below are trailing-12-month median single-family prices across the 8 Greater Princeton Area towns we track (Princeton, Montgomery, West Windsor, Plainsboro, Hopewell, Lawrence, South Brunswick, Robbinsville) as of October 31, 2026. Senior / 55+ housing is excluded. Days on market and list-to-sale are the latest trailing figures. Data is sourced from BrightMLS.
- Princeton: Median $1,695,000 · ▼$15K vs. September · 16 days on market · 100.0% list-to-sale
- Montgomery: Median $1,040,000 · ▼$3.8K vs. September · 16 days on market · 100.5% list-to-sale
- West Windsor: Median $1,149,790 · ▲$10.8K vs. September · 13 days on market · 101.2% list-to-sale
- Plainsboro: Median $1,027,000 · Flat vs. September · 21 days on market · 99.8% list-to-sale
- Hopewell: Median $826,000 · ▼$9K vs. September · 16 days on market · 100.0% list-to-sale
- Lawrence: Median $654,250 · ▲$4.3K vs. September · 15 days on market · 100.2% list-to-sale
- South Brunswick: Median $890,000 · ▲$40K vs. September · 23 days on market · 100.0% list-to-sale
- Robbinsville: Median $931,000 · ▲$1K vs. September · 20 days on market · 100.0% list-to-sale
What Happened in October: Fewer Closings, Slower, and the Unsold Pile Aged Again
September showed the slowdown reaching the closings while the unsold pile held still. October kept the first part and reversed the second. Homes that sold took longer and fewer of them sold above ask, and the listings that had not sold got older in 5 of the 7 inventory groups we track.
Start with the measure we report every month. Across all 8 towns, 27% of October's closings finished above their original list price, against 35% in September (revised from the 36% we first published as late closings reported) and 35% in October 2025. 63% closed below their original list price, against 54% a year ago. Median time on market for those closings was 28 days, up from 23 in September (revised from the 20 we first published as late closings reported) and 21 in October 2025.
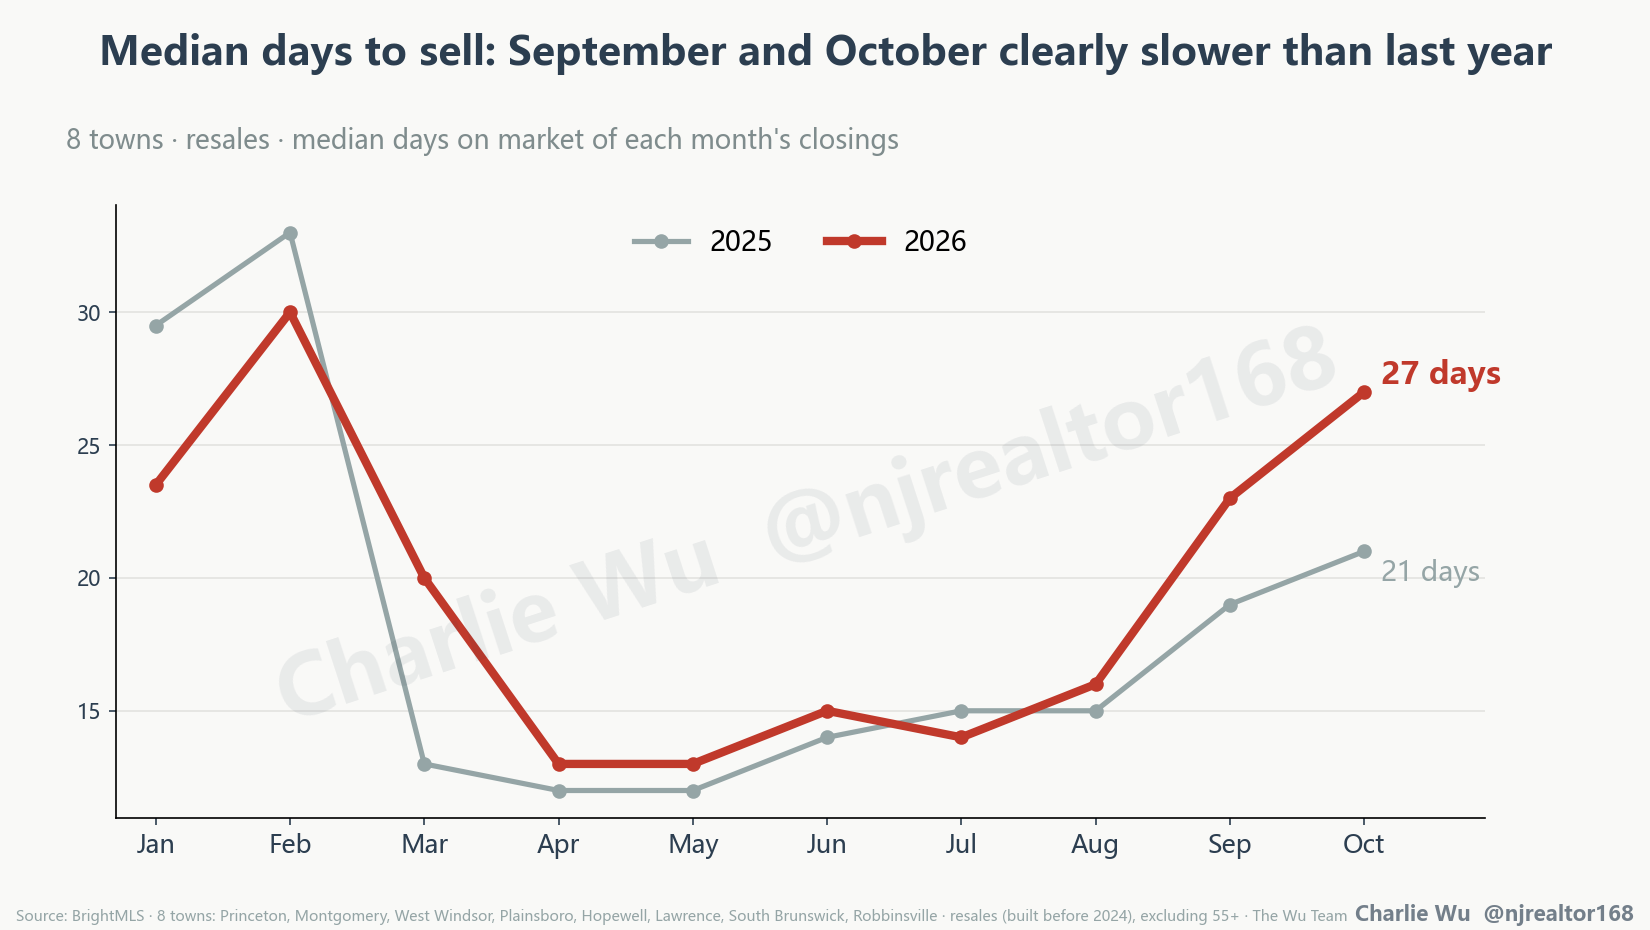
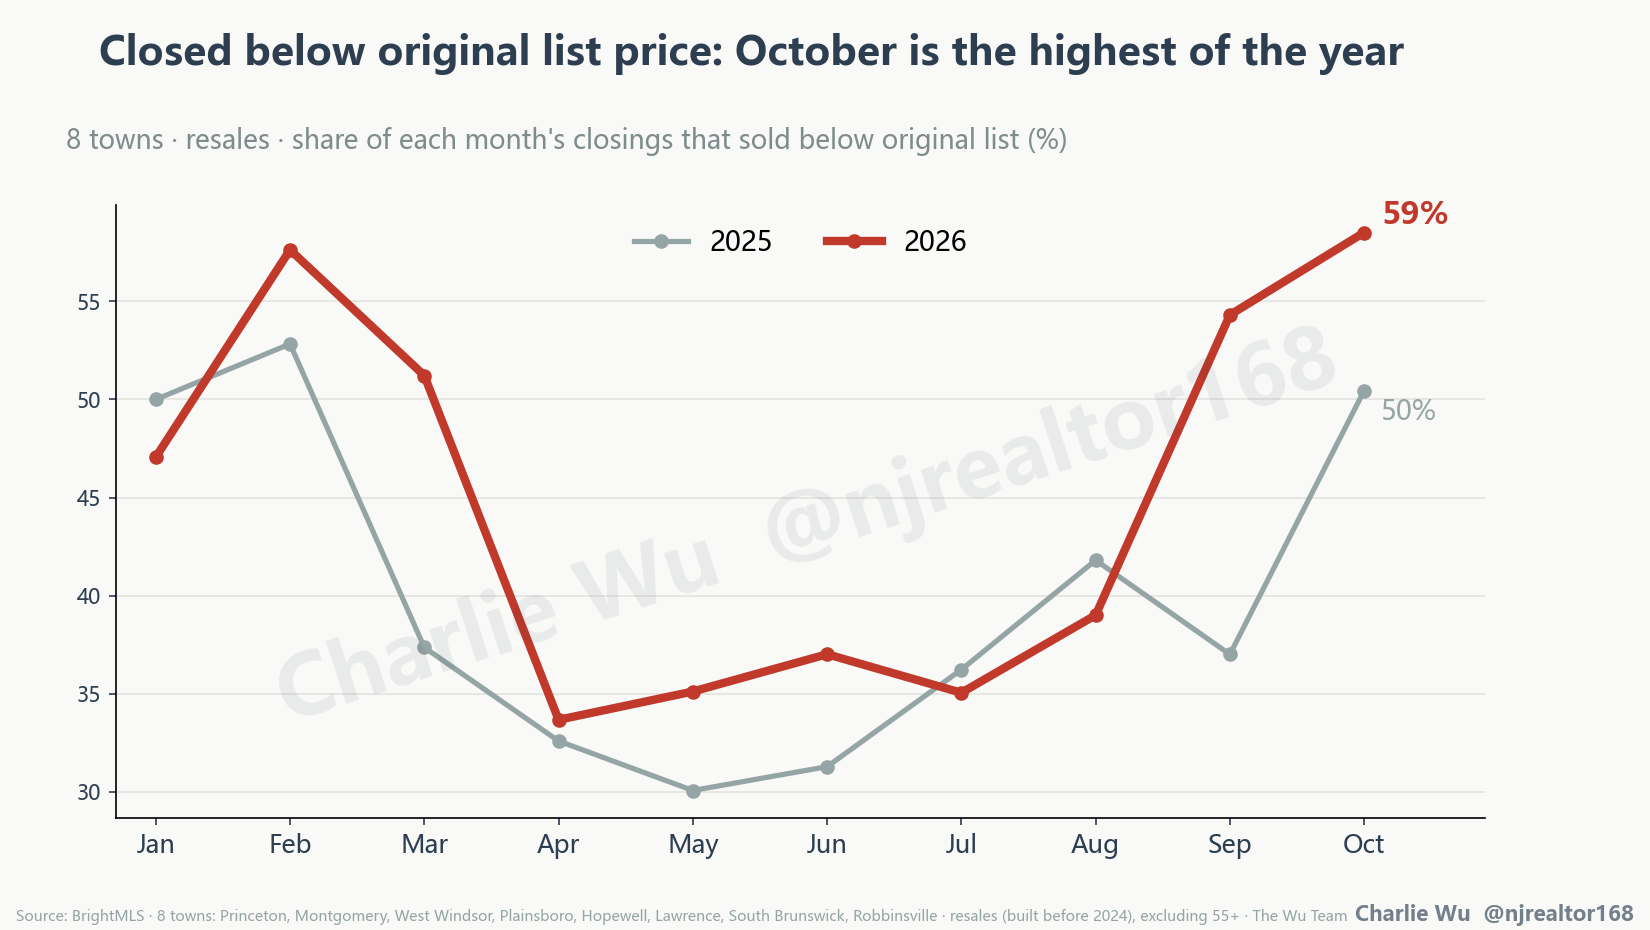
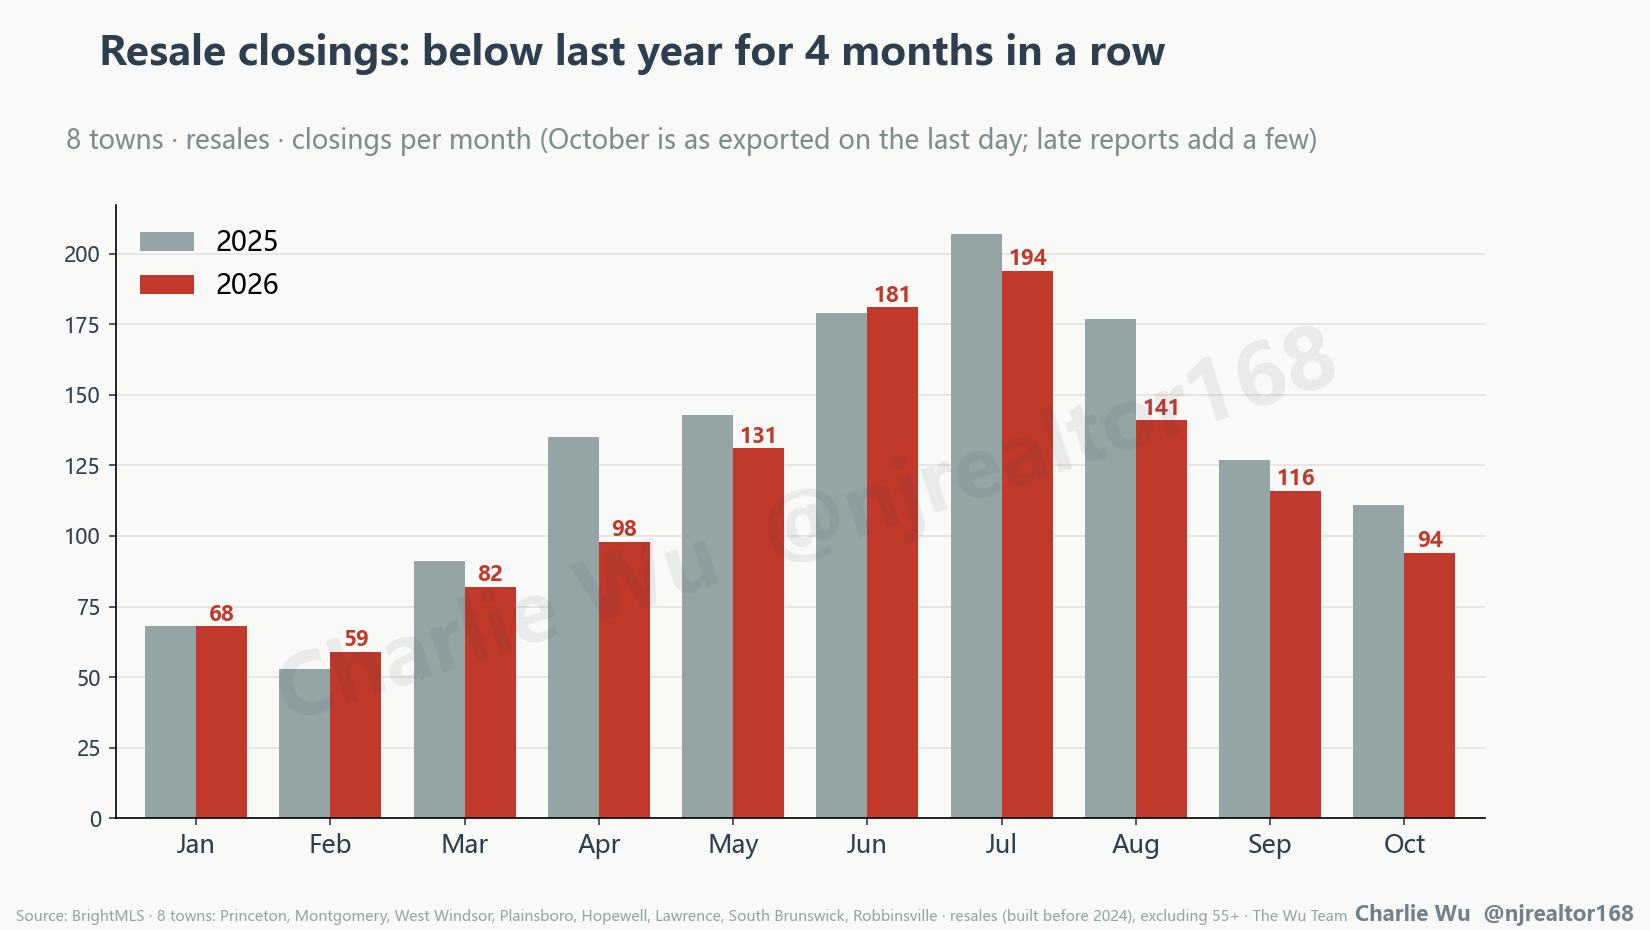
Look only at resales, homes built before 2024, so Hopewell's builder deliveries do not distort the picture. October's resale closings took a median 27 days against 21 a year ago, 31% sold above their original list price against 38%, and 59% sold below against 50%. The 8 towns closed 94 resales in October against 111 a year ago, down 15%. Across all 8 towns, closings through October total 1,320 against 1,357 a year ago, down 3%. Strip out Hopewell, where new construction keeps adding closings, and the other 7 towns are down 10%, from 1,106 to 993. October's count will rise a little as late closings report, as it does every month, but this is the 2nd month in a row that every one of those measures is weaker than a year ago.
The unsold side stopped holding still. After aging in only 2 groups in September, active listings got older in 5 in October. Princeton went from a 78-day median to 90, Montgomery from 48 to 65, Hopewell from 31 to 45, South Brunswick from 36 to 46, and Robbinsville from 42 to 51. Only Lawrence got newer, from 49 days to 46, and the West Windsor-Plainsboro district stayed at 45. The share of listings with a price cut tells a different story by town: Montgomery's jumped from 28.6% to 48.6% and Robbinsville's from 40.9% to 51.1%, while Princeton's eased from 41.0% to 37.3%, West Windsor's from 45.2% to 40.0%, and Plainsboro's from 54.4% to 46.9%. Some of that easing is listings that cut and then sold or came off the market, so it is not a sign sellers are holding firm.
Town by Town
Princeton's trailing median slipped $15,000 to $1,695,000, off the record $1,710,000 it set in September but still 9.4% above a year ago. It remains a lagging number: 12 months of sales, most agreed in spring. The month itself was better than September, with 13 closings against 9 a year ago, including a $3.4 million sale on Russell Road, yet 7 of those 13 still sold below original list. Its year-to-date volume is down 13%. The 59 active listings are the oldest in the corridor at a 90-day median, up from 78, although the share with a price cut eased to 37.3%.
West Windsor posted the biggest gain among the larger towns, up $10,790 to $1,149,790, with the corridor's fastest 13-day median and its firmest 101.2% list-to-sale. October's closings tell a more cautious story: 14 of its 17 closings sold below original list, and its year-to-date volume is down 10%. Its 50 active listings carry a 55-day median and 40.0% have cut price.
Montgomery slipped $3,812 to $1,040,000, now 3.7% below a year ago, and it is where the unsold side deteriorated most: active listings aged from 48 days to 65, and the share with a price cut jumped from 28.6% to 48.6% even as the active count fell from 48 to 35. 8 of its 11 October closings sold below original list. Its trailing 100.5% list-to-sale is still above ask.
Lawrence rose $4,250 to $654,250 and was the busiest town in the group with 24 closings, though that is down from 29 a year ago. It was the only town whose unsold listings got newer, from a 49-day median to 46, and 13 of its 24 closings sold below original list. As the corridor's entry-level market it is the most rate-sensitive town here, with the 30-year fixed still above 7%. Its year-to-date volume is down 11%.
Hopewell fell $9,000 to $826,000. Its 30% year-to-date gain in closings, 327 against 251, is still a new-construction story: homes built in 2024 or later account for 102 closings this year against 30 last year. 5 of its 18 October closings were new builds, 3 in The Collection at Hopewell and 2 in Hopewell Parc, and 14 of the 18 sold below original list. Its active listings aged from a 31-day median to 45, though the active count eased from 92 to 84 and the share with a price cut from 48.4% to 44.7%.
Plainsboro held flat at $1,027,000 and remains the softest town in the corridor, with a 99.8% list-to-sale and the steepest year-to-date volume decline at 22%. Only 2 of its 10 October closings sold above original list and 5 sold below. Its trailing time on market is 21 days, and 46.9% of its 33 active listings have cut price, down from 54.4%. It is still where buyers have the most room.
Robbinsville edged up $1,000 to $931,000, with a 20-day median and a 100.0% list-to-sale. Its unsold side aged again, from 42 days to 51, and 51.1% of its listings have now cut price, the highest share in the corridor. Its year-to-date volume is up 2%.
South Brunswick gained $40,000 to $890,000, the largest dollar move in the group, but it rests on only 53 sales in the trailing year and only 6 closings in October, so treat it with caution. Its year-to-date volume is down 15%, and its active listings aged from 36 days to 46.
Rates and the Macro Backdrop
The Federal Reserve held its benchmark rate at 3.75% to 4.00% at its October 27-28 meeting, after raising it a quarter point in September. The vote was 10-2, and both dissenters wanted another increase. The next meeting is December 8-9. Mortgage rates stayed high: Freddie Mac's 30-year fixed averaged 7.40% in the middle of October before easing to 7.24% for the week ending October 29, against 6.17% a year ago.
Here is why rates matter more than any other number this month. Most buyers shop by monthly payment, not by price. A year ago the 30-year fixed was 6.17%. At 7.24%, the same loan costs about 11.6% more every month (principal and interest, 30-year fixed, 20% down):
- $650,000 home (Lawrence range): $3,175 a month then, $3,544 now, $369 more, or $4,429 a year.
- $1,000,000 home (West Windsor and Montgomery range): $4,884 then, $5,452 now, $568 more, or $6,814 a year.
- $1,700,000 home (Princeton range): $8,303 then, $9,268 now, $965 more, or $11,583 a year.
Put the other way, a buyer who was comfortable with last year's payment can afford a home about 10% cheaper today: roughly $582,000 instead of $650,000, $896,000 instead of $1,000,000, or $1.52 million instead of $1.7 million. Incomes did not rise 11.6% in a year, so for prices to hold, something has to give, and it gives through negotiation first. That is what October's closings show: 59% of resales sold below original list, and the median discount grew to 4.2% from 3.8% a year ago. I expect that pressure to keep showing up in sale prices until rates ease or incomes catch up.
New Jersey's job market improved from a weak summer. The state added 14,900 nonfarm jobs in September, August was revised up to a gain of 1,200 from a loss of 1,700, and the unemployment rate fell from 4.3% to 4.2%. Employment is still up only 3,600 over the year. A steadier labor market is not what the October closings show, though. Rates near 7.25% are doing more to the pace of sales than jobs are doing to support it.
Charlie Wu Market Insight
Charlie Wu Market Insight
September told us the closings were slowing. October told us the listings had noticed. Resales took a median 27 days against 21 a year ago, only 31% sold above their original ask, and active listings aged in 5 of 7 groups, with Princeton's median now at 90 days. The trailing medians still look calm, Princeton at $1.695 million and 4 of 8 towns up, because they are 12 months long and mostly made of spring deals. Last month I said the good pile got smaller and slower. This month the other pile got older.
For sellers: the buyers who are active are not paying for last spring, so price to where the market is now, and preparation matters more than ever. At 7.24%, the same monthly payment buys about 10% less home than a year ago. October's resale closings sold below original list 59% of the time, but prepared, well-priced homes still sell. Plan for 4 weeks rather than 1 weekend. If you are listed and past 45 days, a meaningful reduction now beats 2 small ones later. If your listing has expired or is stuck, see what changed on 2 homes I took over after a first listing ended.
For buyers: more of the inventory is now stale, and stale listings are where you negotiate. Ask for the original list price, the days on market and the price history on everything, and make an offer that reflects them. Montgomery, Robbinsville and Princeton have the most aged listings. Lock your rate when you are under contract; the Fed held in October with 2 members wanting a hike, and nothing suggests relief soon.
Data Table, Greater Princeton Corridor
| Town | Median Price | vs. October 2026 | Median DOM | List/Sale | Notes |
|---|---|---|---|---|---|
| Princeton | $1,695,000 | ▼ $15K | 16 days | 100.0% | Off September's record; unsold listings now a 90-day median |
| Montgomery | $1,040,000 | ▼ $3.8K | 16 days | 100.5% | Unsold listings aged 48 to 65 days; price-cut share up to 48.6% |
| West Windsor | $1,149,790 | ▲ $10.8K | 13 days | 101.2% | Fastest and firmest trailing figures; 14 of 17 October closings below original list |
| Plainsboro | $1,027,000 | Flat | 21 days | 99.8% | Softest in the corridor; YTD volume down 22% |
| Hopewell | $826,000 | ▼ $9K | 16 days | 100.0% | Volume up 30% YTD on new construction; unsold listings aged 31 to 45 days |
| Lawrence | $654,250 | ▲ $4.3K | 15 days | 100.2% | Busiest town in October; only 1 whose unsold listings got newer |
| South Brunswick | $890,000 | ▲ $40K | 23 days | 100.0% | Largest move, but only 53 trailing sales; YTD volume down 15% |
| Robbinsville | $931,000 | ▲ $1K | 20 days | 100.0% | Unsold listings aged 42 to 51 days; 51.1% have cut price |
Source: BrightMLS